

🔑 Key Takeaways
- Master the basics of reading a crypto candlestick chart in minutes.
- Spot bullish and bearish patterns to predict price moves.
- Use support and resistance for smarter entries.
- Practice on real charts without risking money.
- Combine timeframes for clearer chart analysis.
How to Read a Crypto Candlestick Chart: The Basics
To read a crypto candlestick chart, start with understanding what each candle represents—it’s your map to price action without the confusion.
I’ve stared at blurry charts myself as a beginner, feeling lost, but once you break it down, it clicks fast.
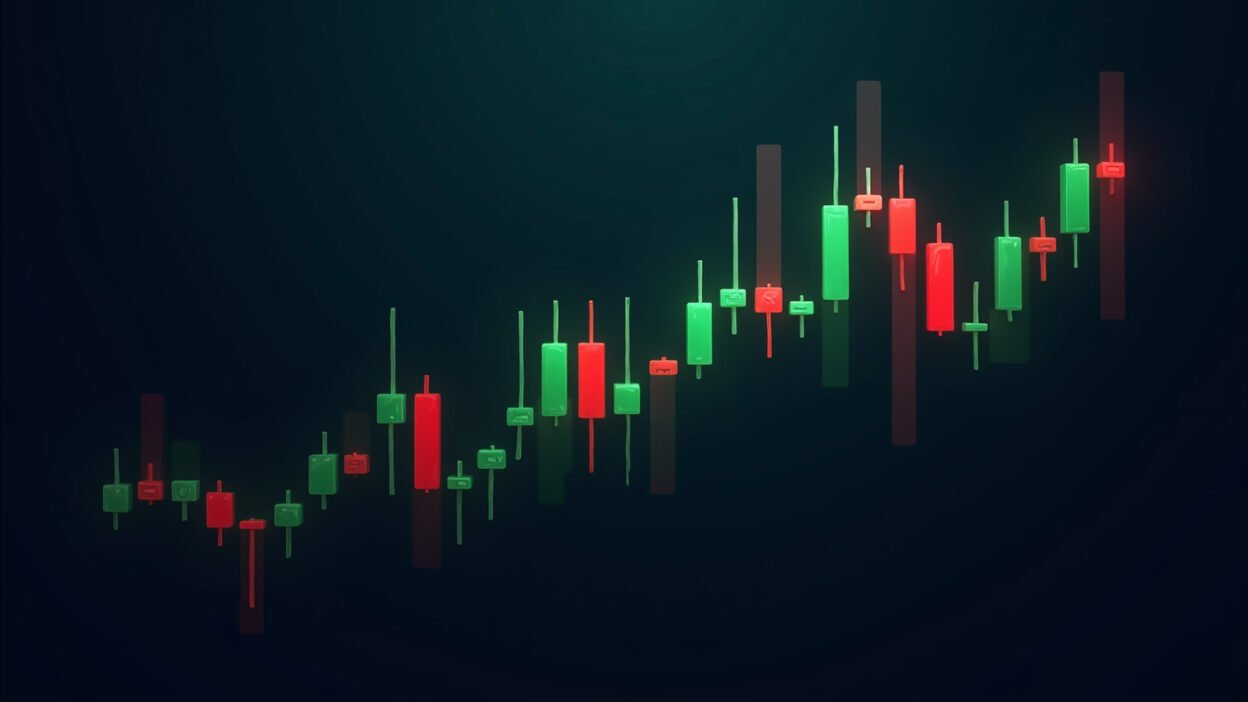
Each candlestick shows four key prices over a set time: open, close, high, and low. The thick part is the body; thin lines are wicks.

Green candles mean close higher than open—buyers won. Red means close lower—sellers dominated.
Timeframes matter: 1-minute for quick trades, daily for big picture. Pick one and stick to it first.
Understanding Bullish and Bearish Candles When You Read a Crypto Candlestick Chart
Bullish candles scream upward momentum; bearish ones signal drops. Spot them to gauge market mood.
A long green body with short wicks? Strong buying pressure, price surged. Long red body? Sellers crushed it.
Small body, long wicks? Indecision—traders fighting, volatility high, common in crypto.
Long upper wick on green? Buyers pushed high but sellers smacked it back. Lower wick? Buyers defended lows.
Practice this: open a Bitcoin chart, zoom to 1-hour, label five candles as bullish or bearish.
Key Candlestick Patterns for Beginners
Candlestick patterns are sequences telling reversals or continuations. Start with simple ones.
Doji: tiny body, long wicks—pure indecision, potential reversal brewing.
Hammer: small body top, long lower wick—bullish at downtrend bottoms, buyers rejecting lows.
Shooting star: small body bottom, long upper wick—bearish after uptrends, sellers rejecting highs.
Engulfing: big candle swallows prior one. Bullish engulfing flips bearish trends; bearish does opposite.
Bullish vs Bearish Three-Candle Patterns
Morning star: downtrend, small doji, then big green—bulls waking up.
Evening star: uptrend, small body, big red—bears taking over.
These aren’t magic but stack odds when confirmed by volume or trend.
How to Read Candlestick Chart Crypto Like a Pro: Support and Resistance
Support is where price bounces up; resistance where it rejects down. Candles at these levels are gold.
Draw lines at swing highs/lows, round numbers like $50,000 BTC. Long wicks there? Strong rejection.
In uptrends, higher highs/lows confirm bullish. Downtrends: lower highs/lows scream bearish.
Tip: start on daily charts. Mark 3-5 obvious levels, watch last 5-10 candles interact.
Candlestick Chart Analysis Step-by-Step Process
Here’s my exact routine to read a crypto candlestick chart without overwhelm.
- Choose timeframe: daily first for clarity.
- Spot trend: higher highs/lows or lower?
- Mark support/resistance: swings, rounds.
- Read sequence: last 3-10 candles as story.
- Check volume: high confirms moves.
Example: BTC daily uptrend pulls to support, long lower wick candle closes green—buy signal.
Next candle strong body higher? Momentum building, enter long.
Bullish vs Bearish Candles: Quick Comparison Table
Real data from recent BTC 1H chart helps visualise.
| Feature | Bullish (Green) | Bearish (Red) |
|---|---|---|
| Body Position | Open bottom, close top | Open top, close bottom |
| Long Body Meaning | Strong buying | Strong selling |
| Long Upper Wick | Rejection of highs | Failed rally |
| Example BTC Price | $65,200 open, $66,500 close | $66,000 open, $65,100 close |
| Market Signal | Upward momentum | Downward pressure |
Common Mistakes When You First Learn to Read Candlestick Chart Crypto
Don’t zoom to 1-minute too soon—noise kills beginners. Ignore single candles; always context.
Skip volume? Patterns lie. No trend check? You’ll fight the river.
Fix: demo account on Binance or TradingView. Paper trade 20 setups, track wins.
Practice Tips for Chart Analysis Mastery
Grab free tools: TradingView, Binance charts. Replay mode simulates live without risk.
Daily habit: analyse ETH, BTC 15 mins. Journal what worked.
Scale up: add RSI for overbought/oversold, but master candles first.
Crypto’s 24/7—news spikes volatility, so wicks everywhere. Embrace it.
Final Thoughts
You now have the tools to read a crypto candlestick chart confidently from day one.
Practice daily, stay disciplined, and those patterns will jump out. Start small, build wins.
Mastering how to read a crypto candlestick chart transforms trading from guesswork to edge.
Frequently Asked Questions
What does a green candle mean on a crypto chart?
Green means close higher than open—bulls in control, upward move.
How do I spot support and resistance?
Look for swing highs/lows where price bounces or rejects repeatedly.
Are candlestick patterns 100% accurate?
No, but they boost odds when combined with trend, volume, support.
Best timeframe for beginners?
Daily or 4-hour—less noise, clearer trends.
Where to practice reading charts?
TradingView or exchange demo accounts, replay historical data.